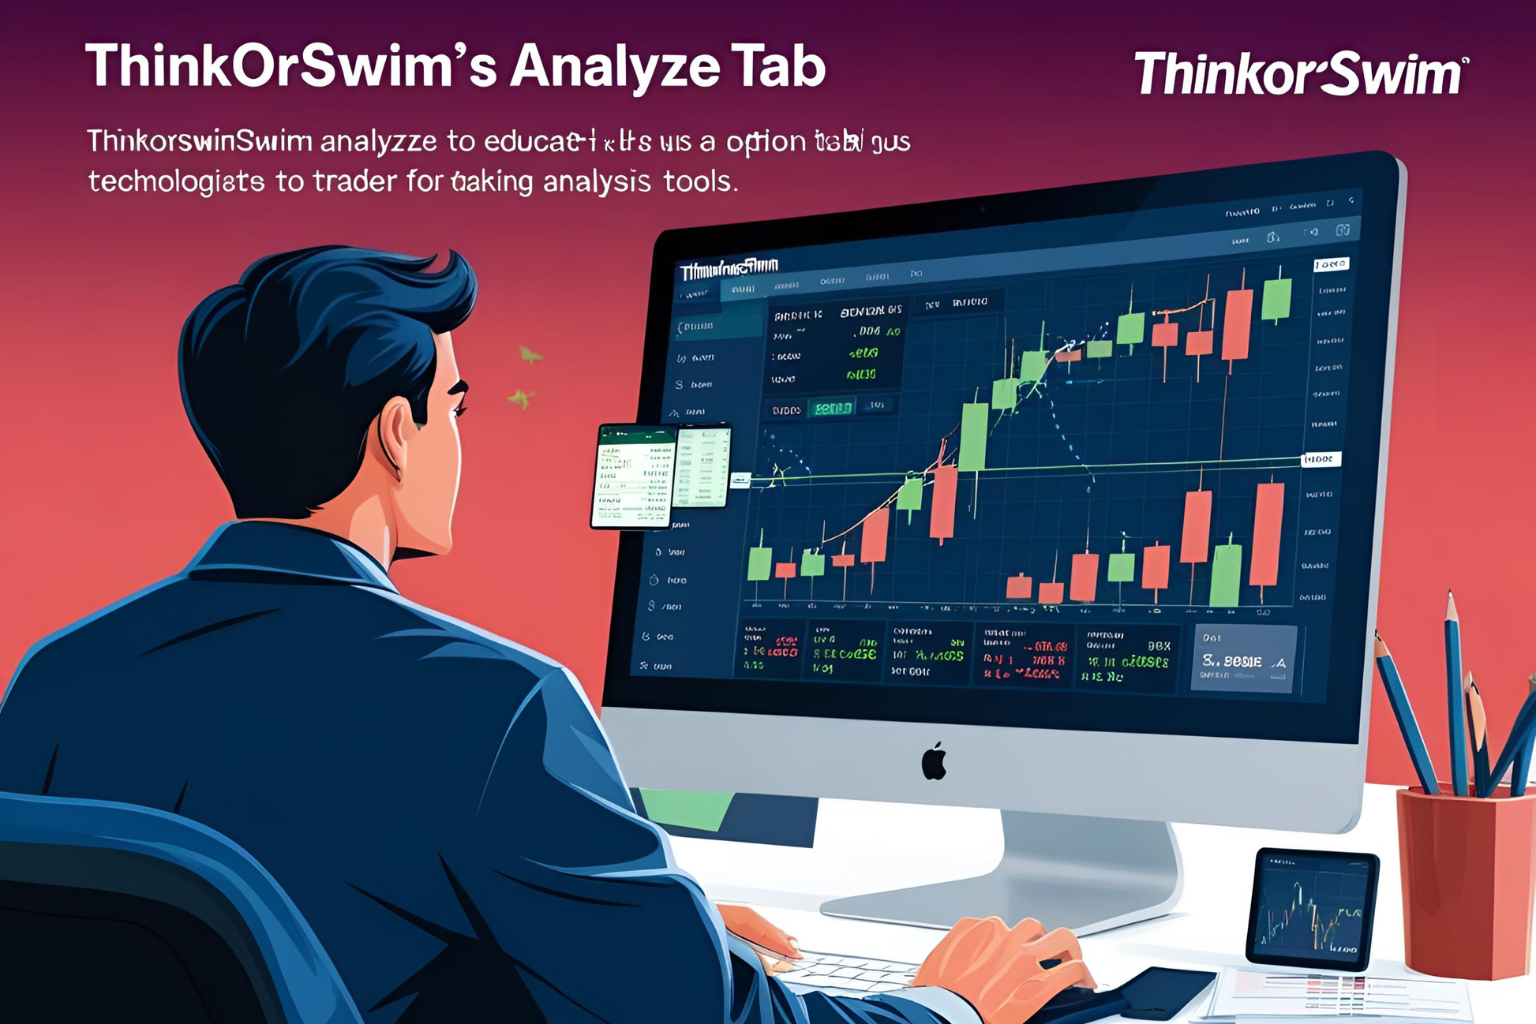
How to Use the Analyze Tab in Thinkorswim for Options Trading
The Analyze tab in Thinkorswim (by TD Ameritrade) is one of the most powerful tools available to options traders. It lets you simulate trades, visualize risk-reward curves, and study real-time Greeks—all before placing a single order.
In this guide, you’ll learn how to use the Analyze tab to gain an edge in planning and managing your options trades.
Why Use the Analyze Tab?
Options trading requires careful risk assessment. The Analyze tab allows you to:
- View profit/loss curves for single and multi-leg strategies
- Simulate changes in price, volatility, and time
- Analyze Delta, Gamma, Theta, Vega over time
- Forecast break-even levels and risk zones
Step-by-Step: Using the Analyze Tab
1. Open the Analyze Tab
- Log into Thinkorswim
- Click on the “Analyze” tab
- Choose “Add Simulated Trades”
2. Enter Your Option Trade
- Type the stock symbol in the top left
- Add a call, put, or custom strategy from the options chain
- It appears in the simulated trades section
3. Switch to Risk Profile
- Click on “Risk Profile”
- You’ll see a graph showing profit/loss at expiration and the current price
- The x-axis is stock price; the y-axis is P/L
4. Adjust Date, Price, and Volatility
- Use sliders or input boxes to test changes in:
- Stock price
- Days until expiration
- Implied volatility (% change)
This helps you simulate real-world scenarios.
5. View Real-Time Greeks
- See how Delta, Gamma, Theta, Vega shift with every input
- Helps you understand risk during:
- Earnings releases
- Volatility crushes
- Time decay phases
Example: Analyzing a Bull Call Spread
- Buy XYZ $100 Call, Sell $105 Call
- Simulate a rise in XYZ to $107
- View the P/L curve to see max gain
- Track Theta decay if price stays flat
You’ll see when to exit, where your risk lies, and how IV affects your setup.
Tips for Effective Use
- Save templates for your favorite strategies
- Use “probability of touching” to plan exits
- Toggle expiration lines to see time-based changes
- Overlay multiple trades for scenario comparison
FAQs
1. What is the Analyze tab in Thinkorswim used for?
It helps traders simulate trades, analyze Greeks, and visualize profit/loss before placing orders.
2. Can I test complex strategies like iron condors?
Yes. The Analyze tab supports multi-leg strategies with real-time modeling.
3. Is this feature free?
Yes. It’s included with any TD Ameritrade Thinkorswim account.
4. Can I backtest strategies in the Analyze tab?
Not directly. Use it for forward simulation, not historical backtesting.
5. Does the Analyze tab work with paperMoney (demo)?
Yes. You can practice and test trades risk-free in the demo environment.